tar xvfj COM_Likelihood_Code-v3.*.tar.bz2
cd plc-3.0
./waf configure --install_all_deps(you may need to change the options on this line depending on your installation; --install_all_deps may not be needed; see the plc_2.0 readme.md for details)
./waf install
source ./bin/clik_profile.sh
echo -e "\nsource $(pwd)/bin/clik_profile.sh" >> ~/.bashrc
Here I assume you have installed CosmoMC in a directory called COSMOMC..PATH. If you haven't done it already, also add CosmoMC's python path (for plotting and analysis of chains) to your ~/.bashrc:
export PYTHONPATH=COSMOMC..PATH/python:$PYTHONPATH
cd COSMOMC...PATH
ln -s DATA...PATH/plc_3.0 ./data/clik_14.0
(CosmoMC will look for files in ./data/clik_14.0/hi_l, ./data/clik_14.0/lowl_l, etc etc.). For 2015 likelihoods you would download the 2015 files and
cd COSMOMC...PATH
ln -s DATA...PATH/plc_2.0 ./data/clik
mpirun -np 1 ./cosmomc test_planck.inito see if things are being loaded and calculate a test likelihood OK.
You can use CosmoMC's python scripts and getdist to analyse and make plots from them. Check you have set the PYTHONPATH as described at the top of the Python readme.
Then download and extract all the chain data. Make a symbolic link from ./cosmomc/PLA to the location of the chains, e.g.
ln -s PLA..PATH ./PLAso that ./PLA/base is for example the head directory with the baseline model chains. For the program to know about the structure of the grid you first need to initialize it for the location you have installed in. Do
python python/makeGrid.py PLA(this step is also done automatically if you open the grid directory in the GetDist GUI). You can now use python, grid and plotting scripts on the PLA directory, and they will know about the available data. Grid configuration settings for the Planck parameter grid are in PLA/config/.
If you download multiple Planck chain bundles, extract them to the same location so new folders are just merged over the existing ones and run makeGrid.py again, then plotting scripts etc will find all the results. If you want to use the +BKP tensor chains, download and add them last, so the config folder matches that in the BKP download.
You can also configure the plotting scripts to use the PLA location as the default_grid_root (esp. if you want to run or adapt sample plot scripts under batch3/outputs/). Make a text file called python/getdist/config.ini (or set the environment variable GETDIST_CONFIG to point to a config.ini file somewhere else) and add setting lines to the config.ini file as required,e.g.
default_grid_root =  PLA..PATH
cache_dir = PLA..PATH/cache
output_base_dir=
The cache_dir is used to cache python-format chains, which makes loading them much faster after the first time. By default, plots go into ./outputs directory under cosmomc. You can se the output_base_dir to another location is where plot output (e.g. pdf) files are put by default (in output_base_dir/outputs).
For example, to run the sample scripts, you can do
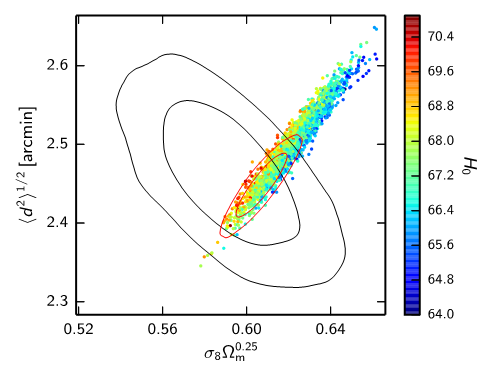
python batch2/outputs/lensonly_direction.pyto reproduce the figure above. (assuming you downloaded and installed the full PLA chain grid; default output location is ./outputs).
For instructions on writing plotting scripts, or how to calculate new derived parameters, see the plotting and analysis scripts readme.